X-ray binaries are among the the most luminous X-ray sources seen in our Galaxy. Circinus X-1 is one of the most luminous of these; its X-ray luminosity is about 100 billion times the X-ray luminosity of our Sun. (Credit: NASA).
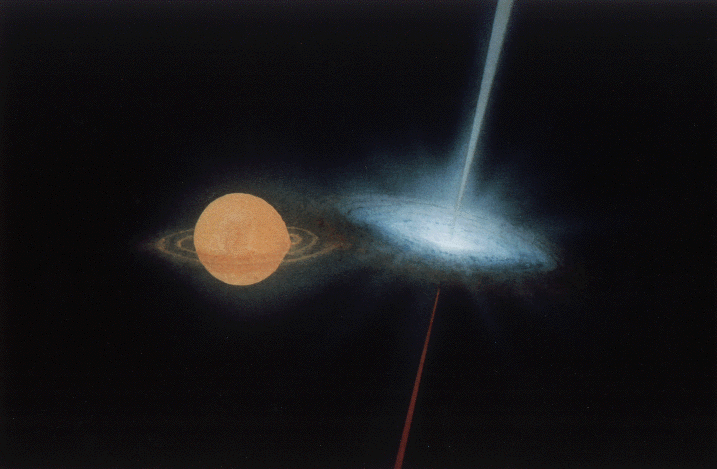
Artist's impression of an X-ray binary system like Circinus X-1. In the
case of Circinus X-1, the system contains a normal star not much
different from our Sun (shown as orange) and a
neutron star with an accretion disk around it (shown as blue-white)
orbiting each other. The orbital period is 16.5 days. Matter is pulled off
the normal star by the gravity of the neutron star, and it settles into
an accretion disk around the neutron star. X-rays are produced when matter
from the accretion disk approaches and strikes the surface of the neutron
star, hence the name `X-ray binary.' In addition, material is blasted out in
two jets from the vicinity of the neutron star.
X-ray binaries are among the the most luminous X-ray sources seen in our
Galaxy. Circinus X-1 is one of the most luminous of these; its X-ray
luminosity is about 100 billion times the X-ray luminosity
of our Sun. (Credit: NASA).
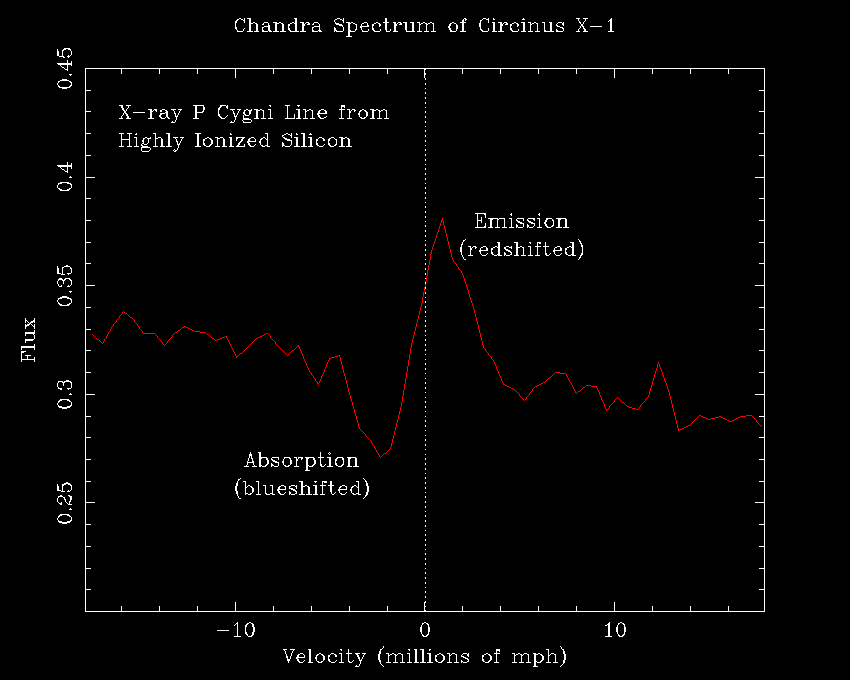
An example of a `P Cygni spectral line' as seen by Chandra from Circinus X-1.
The plot shows an X-ray spectrum with a spectral line created by highly
ionized silicon atoms. These atoms are located in a wind flowing outward
from the Circinus X-1 system. The combination of redshifted emission
(from material moving away from us) and
blueshifted absorption (from material moving towards us), as
shown in the plot, defines a P Cygni line and
is the characteristic signature of an outflowing wind.
The P Cygni line can be used to study the geometry and dynamics
of the outflowing wind, and this is its key scientific importance.
In this case, as the plot shows, the wind appears to be flowing outward
with velocities of up to about 4.5 million miles per hour (mph; about
7.2 million kilometers per hour). In the Chandra spectrum of
Circinus X-1, we see many P Cygni lines like the one above
from the chemical elements neon, magnesium, silicon, sulfur
and iron; above we have only shown one of the many P Cygni lines
for clarity of presentation. The P Cygni lines are seen within
the bright and variable X-ray continuum emission generated
near the neutron star.
P Cygni lines are named after the famous star P Cygni, since it shows
such lines when studied in optical and ultraviolet light (see the links
below). The P Cygni lines Chandra has found from Circinus X-1 are, to our
knowledge, the first ones reported in X-ray light.
(Credit: Niel Brandt and Norbert Schulz).
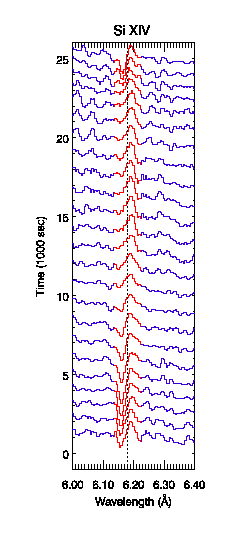
The shapes of the P Cygni lines vary with time. The plot above shows
snapshots of the spectrum of Circinus X-1 taken approximately
every 15 minutes; time advances moving from the bottom to the
top. These snapshots are centered around a line created by highly
ionized silicon atoms (highlighted in red).
The line shape at the bottom of the plot clearly shows the classical P Cygni
line profile with redshifted emission and blueshifted absorption. In the
middle of the plot (that is, after about 3 hours), the line merely
indicates emission but no absorption. After 6 hours (at the top of
the plot), the line shape is back to the P Cygni profile.
(Credit: Niel Brandt and Norbert Schulz).
Animation showing the strong variability over time of one of the
P Cygni spectral lines seen by Chandra from Circinus X-1. Again, the
P Cygni line shown above is made by highly ionized silicon atoms. The
dotted green line shows the center of the P Cygni spectral line. Note
that the strengths of the redshifted emission and blueshifted absorption
change quite strongly over time. Each of the 25 time steps shown
above represents 1000 seconds. After the 25 steps, the animation
repeats. (Credit: Niel Brandt and Norbert Schulz).
Other Relevant Links and Images: